This is an old revision of the document!
Projects Map
After signing in to your GeoCloud account a screen showing the Projects Map shows up - Figure 3:
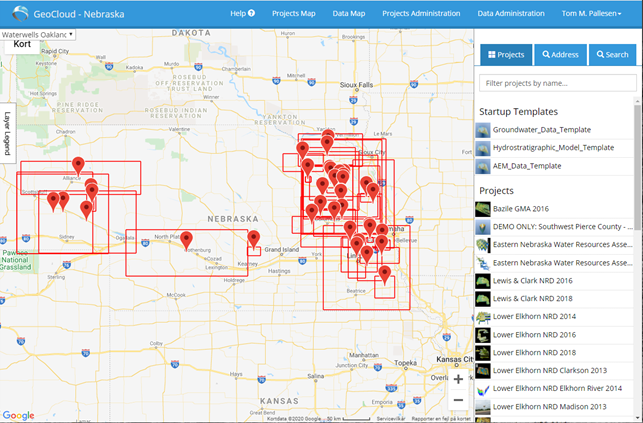
Figure 3: User interface (Projects Map).
The Projects Map is the main entrance to the GeoCloud for administrators and regular users. It is the page that gives you the general overview of projects (and associated data). From here, data and GeoScene3D templates can be downloaded and used for further work.
The example shown in Figure 3 is the University of Nebraska’s GeoCloud. The content in the window will vary depending on the setup of the individual GeoClouds and is to some degree customizable.
Figure 4 and Table 1 gives a general description of the most important features in the Projects Map.
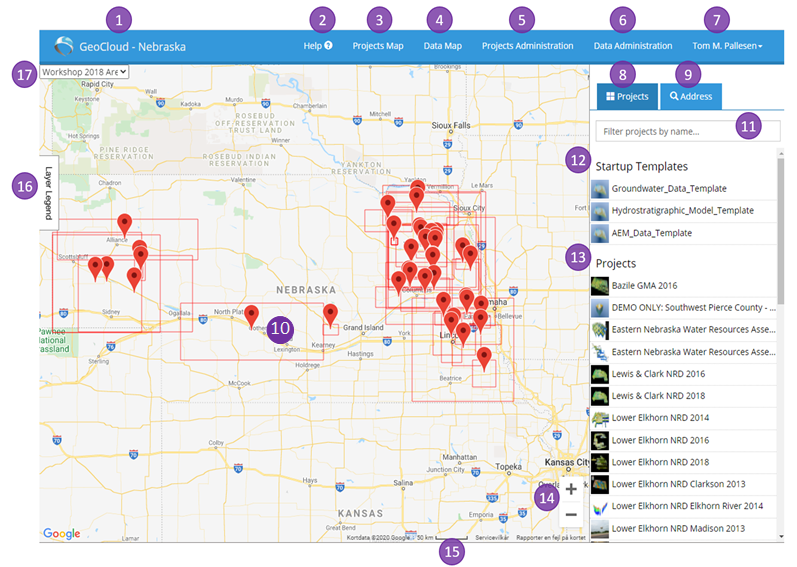
Figure 4: Project Maps (#3, in Table 1) user interface. Numbers are explained in Table 1.
Table 1: Explanation keys referring to Figure 4. Further explanation follows the table.
| # | Name Key | Access Level |
|---|---|---|
| 1 | Name of the GeoCloud | 1+2+3 |
| 2 | Help functionality (Wiki Help) | 1+2+3 |
| 3 | Opens the Projects Map when you are on another page (Figure 3) | 1+2 |
| 4 | 1+2 | |
| 5 | 1+2 | |
| 6 | 1+2 | |
| 7 | 1+2+3 | |
| 8 | 1+2+3 | |
| 9 | 1+2+3 | |
| 10 | Project content window. | |
| 11 | Text field for writing an address/project name. | 1+2+3 |
| 12 | Administrator defined GeoScene3D Project templates. Gives the users the option to select a GeoScene3D template which includes a predefined setup. After selecting a template, the user points out an area (template specific) in the Project Map window and downloads a GeoScene3D project file (*.gsmod). This file can be opened in GeoScene3D, from which Cross Sections, Map Windows etc. can be viewed. GeoScene3D project content depends on where the template is placed in the map window. Requires installation of GeoScene3D Free Viewer or up. | |
| 13 | Projects are collections of datasets associated with a project. A project can be a mapping survey, investigation area, State, focus area etc. Individual datasets from the projects can be downloaded (file formats, see #5). | |
| 14 | Zoom in/out in Map Window. | |
| 15 | Scale – zoom dependent. | |
| 16 | Layer Legend. Defined by the GeoCloud administrator and based on #17. | |
| 17 | Option to change background map. Maps are defined by the administrator and are based on WMS. |
The Projects Map shows the maximum extent of all the projects created on the GeoCloud (red boxes). A red pin is assigned to the individual projects. A project can contain one or more datasets. By holding the mouse over the pin, the name and the project is shown. By clicking on the pin, a window opens - Figure 5:
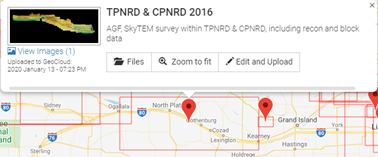
Figure 5: Project content window.
The same window opens when you click on the projects in the project list (“Projects”) to the right.
In the example above, the project is called “ CKGE_TMP_i TPNRD & CPNRD 2016 CKGE_TMP_i ”. The administrator has added a project description below the project name (“ CKGE_TMP_i AGF, SkyTEM survey within TPNRD & CPNRD, including recon and block data CKGE_TMP_i ”) and added an image to the left. Below the image is an upload date, showing the latest date of data upload.
By clicking on the Files tab, a list of project files is shown - Figure 6.
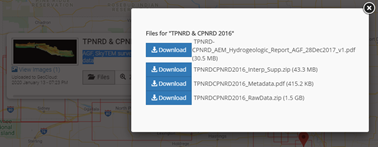
Figure 6: List of files in the “TPNRD & CPNRD 2016” project.
Files name and size are shown. By clicking on the individual files, the user get access to download those (pdf-files are pre-viewed in your web browser, other files must be downloaded to be opened). The user is prompted where to save the files.
The “ CKGE_TMP_i Zoom to fit CKGE_TMP_i ” tab, zooms the scene into the project extent.
“ CKGE_TMP_i Edit and Upload CKGE_TMP_i ” redirects the user to the Projects Administration page (#5 on Figure 5) - Figure 7 (access level depending). This page is also accessible from the Projects Administration tab, from where a list of existing projects is shown.
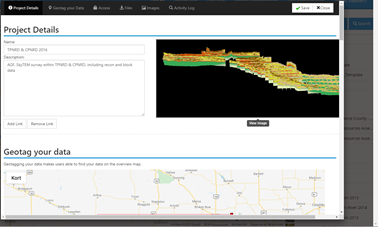
Figure 7: Projects details etc. can be edited here.
