This is an old revision of the document!
Data Map
The Data Map shows all the individual data sets, that has been uploaded to the GeoCloud through the Data Administration page (File Upload).
The Data Maps holds multiple options and visualizations tools.
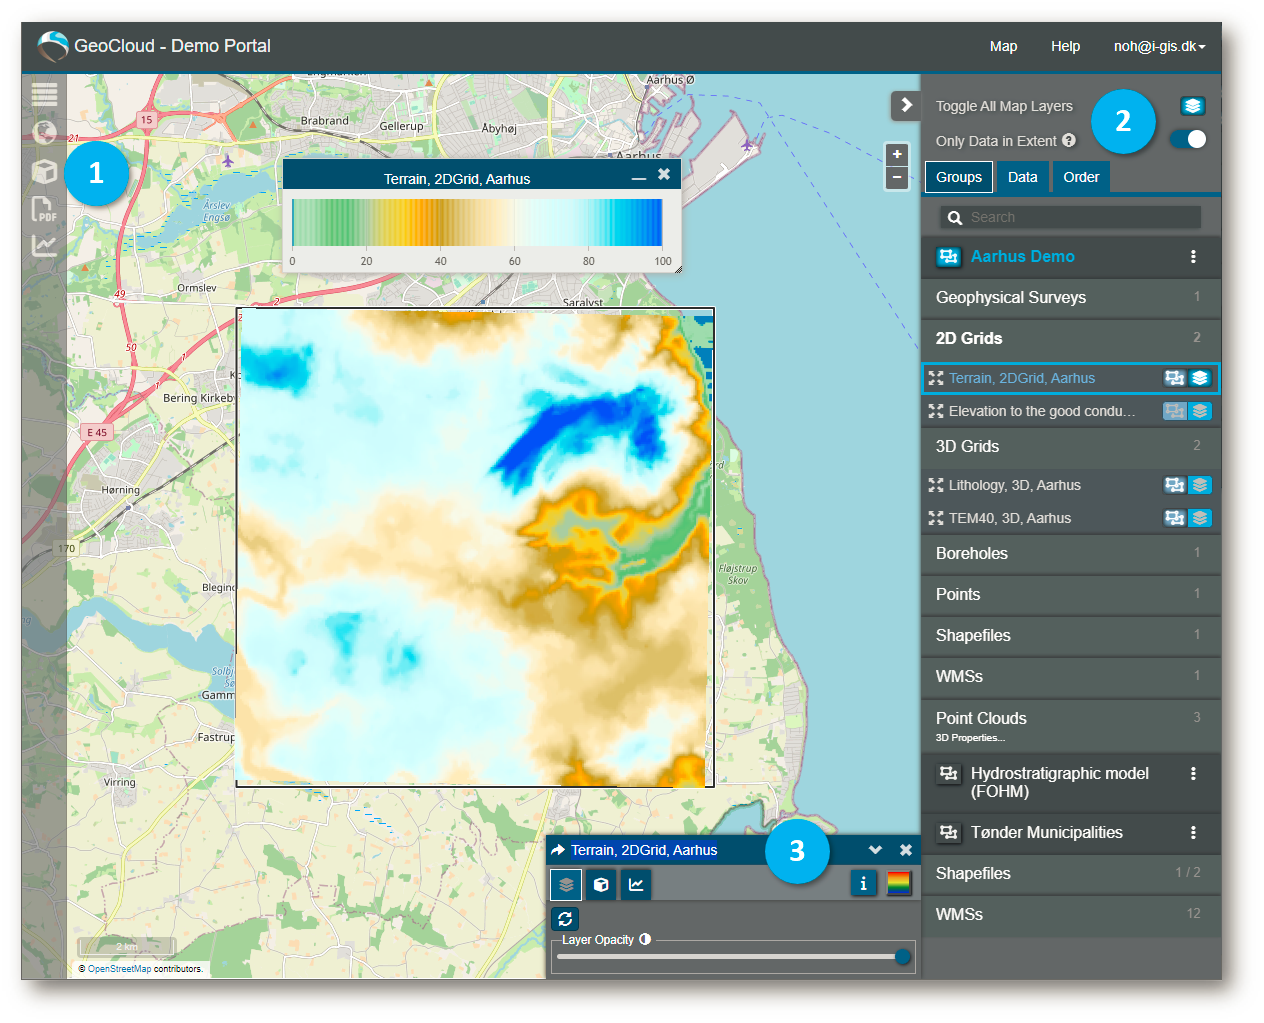
The following three sections within this page will give you an overview of how you can maximize the value of your data.
1 - Map Tools
2 - Data Manager
3 - Data Settings
1 - Map Tools
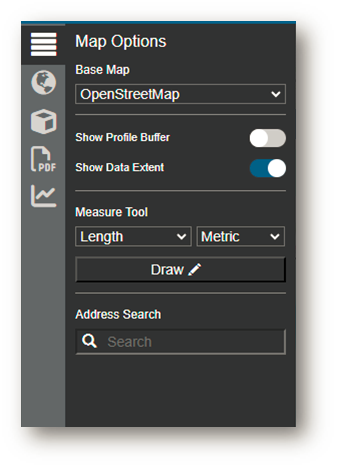
Map Options
Base Map - Offer the possibility to choose between Open Street Map, Bing Maps with Aerial Labels, Bing Maps Gray and Bing Maps Dark
Show Profile Buffer - Adds the profile buffer extent on the map with a dashed outline around the drawn profile
Show Data Extent - Adds an outline to selected data to show its extent
Measure Tool - Allows the user to measure distances on the map (Single click adds points, double click ends the measuring)
Address Search - Search for an address - only within the base map
 - "Get WMS For Data” allows the user to select a data type and create a OWS (WMS and WFS), a tile service (WMTS, TMS or XYZ) and editable WFS (WFS-T) to be used in other applications.
 - Open the 3D Window.
 - Create PDF reports for profiles and map
 - Create Profiles
2 - Data Manager
Enable Data
This button activates data on the map. When hovering the cursor over this button, that data flashes within the map window.
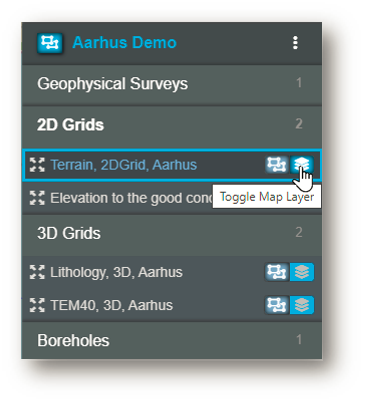
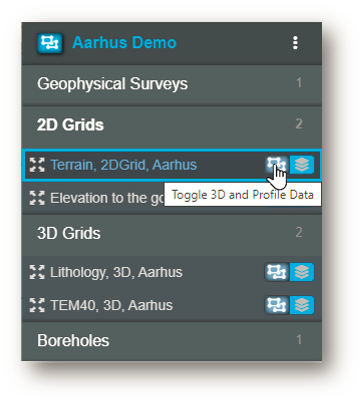
This button activates data for profiles and in the 3D Window. Data must be placed in a Group before they can be shown on profiles or in the 3D Window.
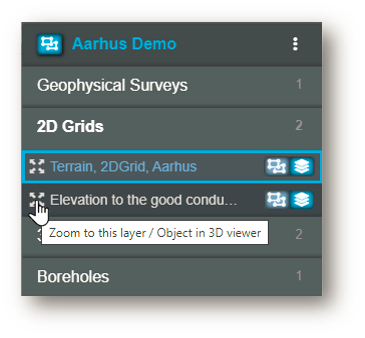
Zoom to layer
This button zooms to the data layer within the map or the 3D window.
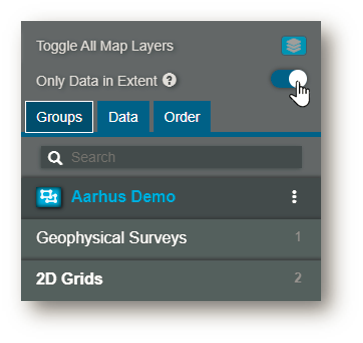
Only Data in Extent
This button hides all data not located in your current map extent.
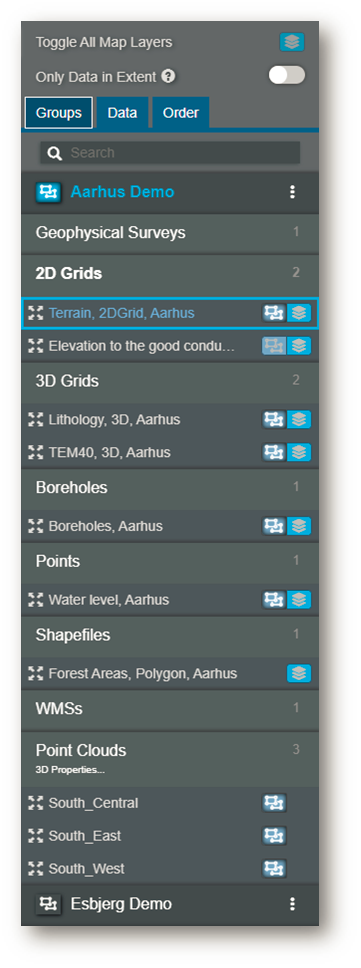
Groups tap
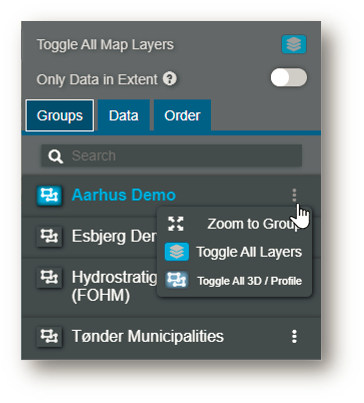
When activating the “Groups” tap you can arrange the data menu bar by the groups defined by you or the project in Data Administrator. Click the  to activate your data for profiles and to view in the 3D window. When clicking on a group the user can expand or collapse the group.
Only the data in the activated group will be used to generate profiles and shown in 3D window. If you need to generate a profile or view in 3D for data from more than one group, you must create a new group in Data Administrator with those data sets. You can have the same data sets in multiple groups.
You have the option to zoom to the group, toggle all layers to the map and/or toggle all layers active in 3D / Profile.
Data tap
When activating the 'Data' tap, you can see all data in your GeoCloud portal, regardless of which group the data is placed in. The data is divided into GeoClouds predefined data categories. You can open each data category and activate data individually or you can activate all data within a single data category at once. The number shown at each data category reflects the amount of data within your present map extent and the total amount of data. When clicking on a data category the user can expand or collapse the category.
In the Data tap, you can't use the profile or 3D window functionality. The data must be in a Group and have the Groups tap active.
The last data category is used to add a temporary WMS to your project. The WMS data and connection will disappear when you log off the GroCloud portal. For a permanent WMS connection, read the WMSs page.
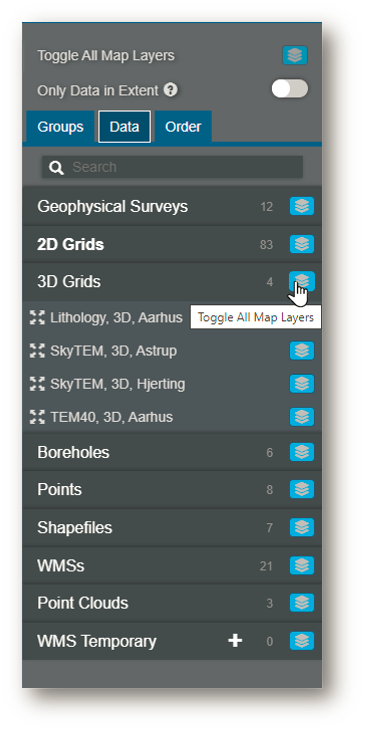
The predefined GeoCloud data categories:
- Geophysical Surveys (Geophysical AEM surveys; flight lines shown as point data)
- 2D Grids (shown as maps)
- 3D Grids (shown as 2d grid slices/maps)
- Boreholes (shown as points)
- Points (point observations shown as points)
- Shapefiles (various)
- WMSs (various)
- Point Clouds (point cloud formats shown as points)
- WMS Temporary (Various, data will disappear after logging off)
Order tap
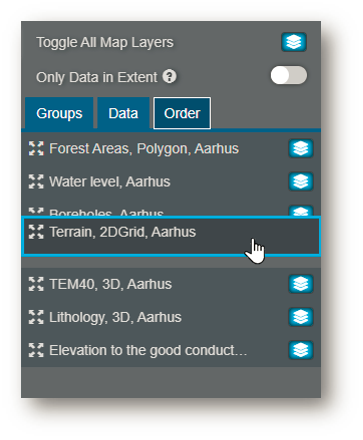
This tap only shows the enabled data layers. Enables the user to change the order of data appearance in the Map Window. Works as drag and drop. Typical used for better visibility of selected data.
3 - Data Settings
When you click at a specific dataset in the Data Manager, you open the 'Data Settings' window in the bottom right corner of the map extent.
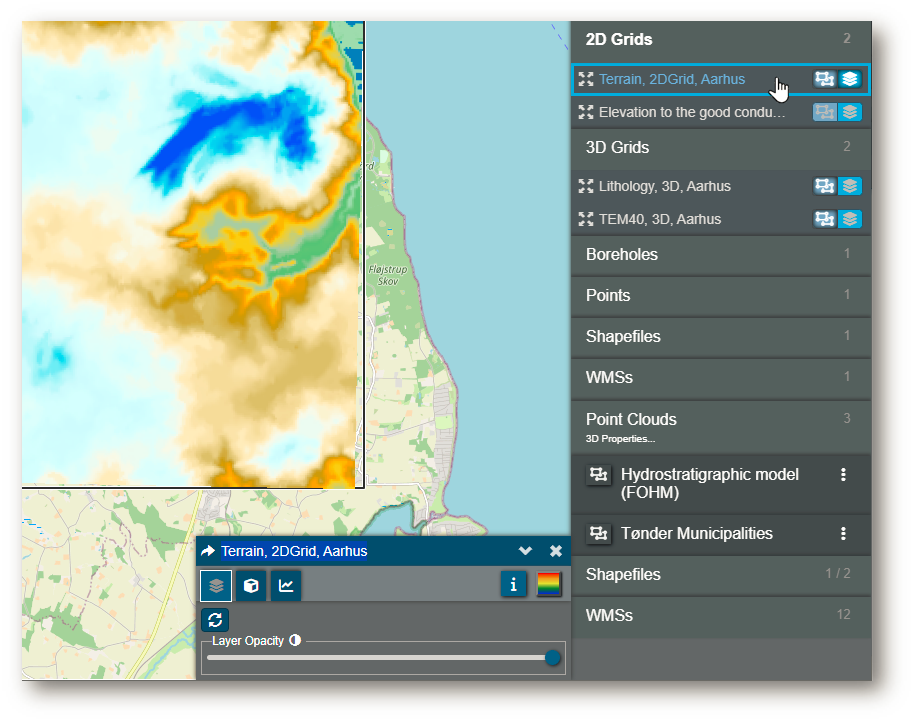
 - show color scale or symbol list - you can change color scale and/or symbol list under Material.
 - refresh the data within the map
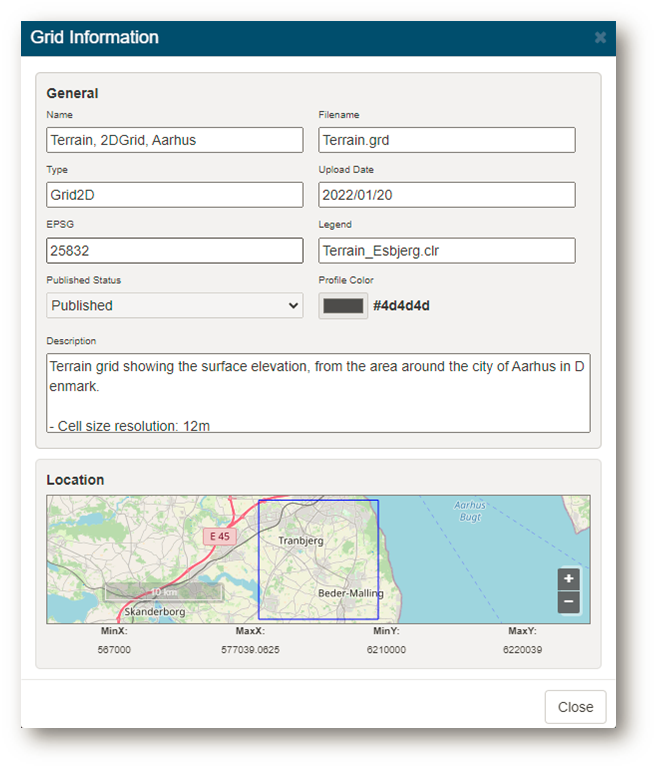
 - open the data information window as shown below
The Data information window, shows you information about the specific data set, including the bounding box. It further enables you to download the data file and the legend. If you want to change any of the data information for the data go to Data Administration.

