3D Window
Before data can be seen in the 3D Window, it must be added to a group and actived by the  in the Data Manager.
Furhtermore, the group must be selected with the  button.
Not all data can be shown in the 3D window. As an example the Shapefiles, WMS data and Misc data can not be shown in the 3D Window.
To open the 3D window, move the mouse to the  button. Afterward click at the 'Open 3D Viewer'.
When opening the 3D window, it can look something like below.
Here you can see the selected data in the selected group. In the upper right corner you can see which direction you are looking.

You can open the map, simply by clikking at the map icon. This will show you the data extent and your camera placement. The red triangle represents the camera. At the picture below, the camera is looking towards the north.

You can edit the fly spped, by dragging the grey beam towards the left, for moving slower (10 is the minimum) or towards the right for moving faster (5000 is maximum).

You can edit the 'Point budget', by dragging the grey beam left or right.This edits the amont of points you can see in the 3D Window. The more points, the higher the details. Minimum is 0.1 million and Maximum is 15 million points. The higher the Point budget, the longer it takes to load all the points when moving around in the 3D Window.

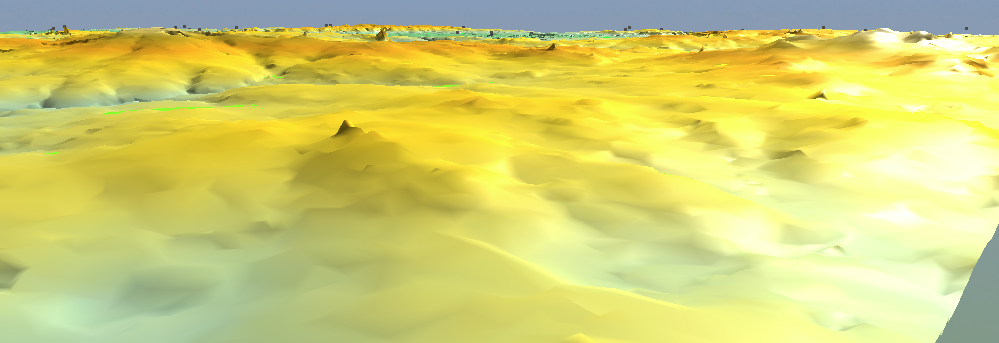
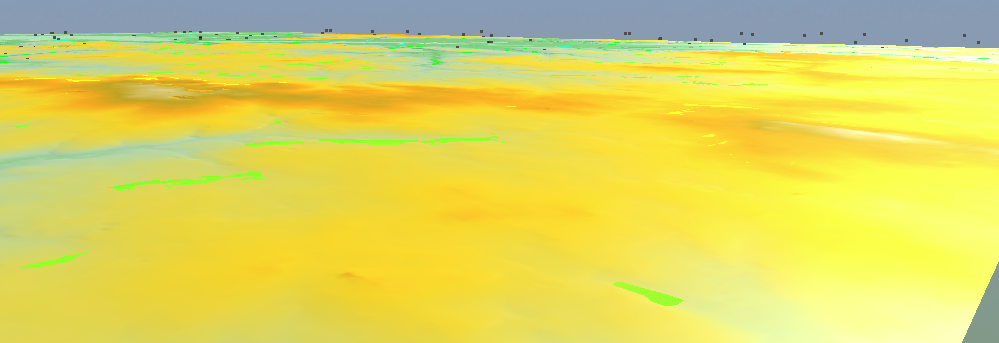
You can edit the Vertical Scale, by dragging the grey beam left or right. the minimum is 1 and the maximum is 10.

Below the Vertical Scale is 10:

Below the Vertical Scale is 1:

You have two different navigation options. The 'Fly' (default) option and the 'Orbit' option.


You have 3 different measuring tools(works best when data are shown as point clouds).
Points measurement: measure the values given to a given datapoint.
Distance measurement: measure the distance between two points.
Circle measurement: measure the radian within a circle.


You have 3 different Tool (works best when data are shown as point clouds).
Elevation profile: allows you to draw a profile through the point cloud data.
Annotation: gives the data an Annotation.
Cut-out: Look inside the point cloud data, but cutting out areas of the dataset.


When working with data in the 3D Window, you can change the data settings, for the different data in the 3D Window.
For 3D grids you can filter the values you like to see in the 3D Window.

For 2D grids you can edit the 3D view style and the 3D tranparency.

For Survey data you can edit the 3D view style.

For borehole data you can edit the 3D view style and enable labels.

